


How do you know if your portfolio will last through retirement?
Markets are unpredictable, inflation is relentless, and life doesn’t follow a neat curve. Yet many retirement plans rely on a static estimate: a fixed average return, compounded neatly for 30 years. Reality is messier. That’s where a Monte Carlo simulation comes in: a tool that embraces uncertainty to help you plan with humility, not hubris.
It’s a tool I made using lovable.app, and you can access it from the link below, but before you start using it, though, read on to understand how to use it effectively.
What is Monte Carlo Simulation in Investing?
Monte Carlo simulations model the range of possible outcomes by running thousands of hypothetical “futures” for your portfolio. Rather than assuming a smooth ride, it embraces randomness: bull markets, crashes, and stagnation. The output? A probability distribution of outcomes that helps answer a vital question:
“Will my money last?”
Whether you're saving aggressively in your 30s, planning to coast into early retirement, or drawing down funds in your 70s, a Monte Carlo simulator can offer clarity in the face of uncertainty.
Key Simulator Inputs
Each Monte Carlo simulation is only as insightful as the assumptions behind it. Here’s a breakdown of what you can configure, and why each piece matters when projecting your portfolio’s resilience through retirement.
Initial Investment
The lump sum you begin with. This is your portfolio’s starting balance; it can be your current savings or a hypothetical amount for planning.
Annual Contribution
The amount you plan to add each year before retirement. This input simulates continued saving during your working years and can significantly improve your odds of success, especially early on.
Time Horizon
The full length of the simulation, in years. This typically spans from now until the end of your expected life, e.g. 30 years if you're retiring at 60 and planning to project to 90.
Retirement Year
The year (relative to the simulation’s start) when you stop contributing and start withdrawing. A 20-year retirement year in a 30-year horizon implies 10 years of savings and 20 years of drawdown.
Base Withdrawal Rate (%)
This is how much you plan to withdraw annually from your portfolio in retirement, expressed as a percentage of your balance. Common starting points are 3–4%, but the sustainability depends on market conditions and volatility.
Annual Inflation Rate (%)
Retirement isn’t just about nominal dollars. Inflation erodes purchasing power over time. This input adjusts future withdrawals and returns to reflect real-world costs.
Asset Allocation
You can set your investment mix across:
Stocks
Bonds
Cash
Crypto
This allocation defines both the risk and expected return profile of your portfolio. Stocks tend to have higher returns and volatility; bonds and cash have lower returns but offer stability. Crypto can provide asymmetric upside but also comes with significant uncertainty.
Remember: Your asset mix drives your portfolio’s volatility and exposure to sequence of returns risk.
Other Simulation Settings
Variable Withdrawal Rates
When enabled, you can adjust withdrawal assumptions over time; this is useful for modeling phased spending, lifestyle changes, or adjusting drawdowns in volatile years.
Number of Simulations
More simulations (e.g. 5,000) provide more robust statistical insights. Each run simulates a unique series of market returns drawn from historical data and variance assumptions. The default value of 5,000 provides the best information on whether a given portfolio can last all possible scenarios.
Understanding the Output
Once you run your simulation, you'll see results like:
Probability of Success
Median, Best, and Worst Case Final Balances
Annualized Return (CAGR)
Growth Projection Curve with Percentile Bands
Here’s how to read them and what they mean for your financial future:
Probability of Success
This is the percentage of simulations where your portfolio ends with more than $0, meaning you didn’t run out of money before the end of your time horizon.
100% success rate: In all simulated futures, you made it. But…
Don’t get complacent; a 100% success rate doesn’t mean you’ll end up rich. You may still finish with a modest amount or just barely get by.
A high success rate tells you you’re unlikely to go broke, but it doesn't guarantee comfort or wealth. Look deeper into the outcome distribution.
Final Balance Scenarios: Median, Best, Worst
These values help you assess not just survival, but also the quality of outcome:
Median Final Value: This is the “middle of the road” result. Half of your simulated futures finish with more than this, half with less.
Best Case (90th Percentile): A very good run, representing the top 10% of outcomes.
Worst Case (10th Percentile): A challenging market sequence, one that could happen.
Example simulation:
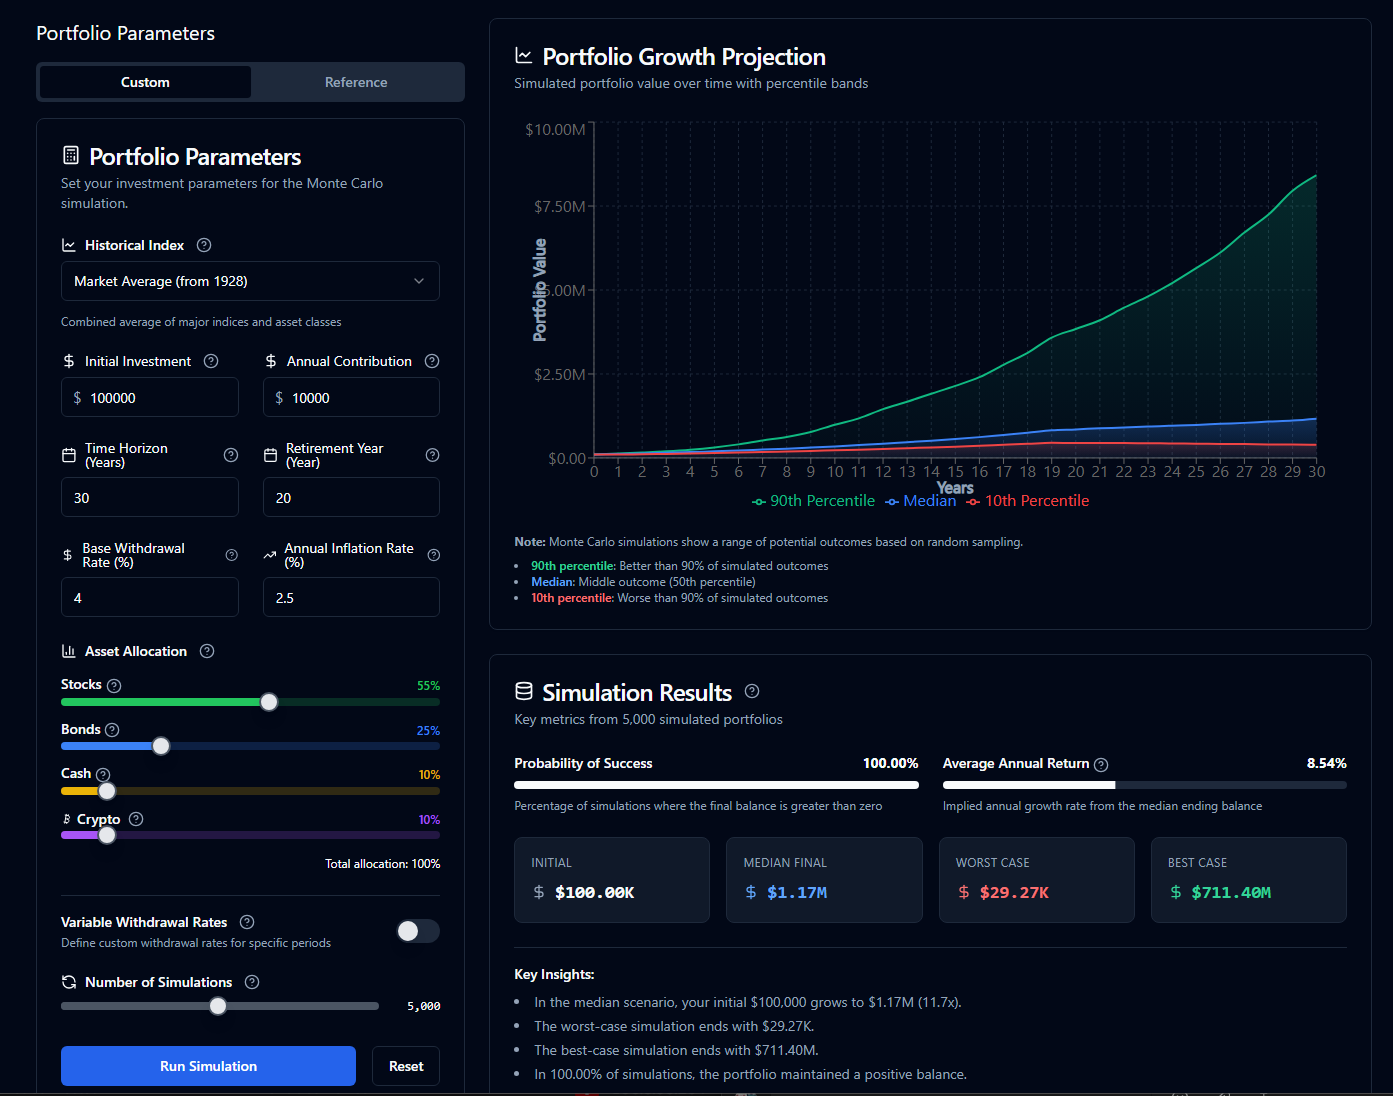
Median: $1.17M → you grow 11.7x from a starting point of $100K.
Worst Case: $29.27K → you barely hang on.
Best Case: $711.4M → Highly unlikely due to crypto having a shorter history with explosive returns, but it shows the power of compounding and lucky sequences.
Pay attention to how wide the gap is between the 10th and 90th percentiles. A wide spread signals high volatility and uncertainty, which may not be ideal for retirees relying on steady withdrawals.
Important: Any allocation to crypto should be taken with a grain of salt, as it can drastically skew your returns and may give a false sense of success.
Reading the Chart
The growth chart shows three bands:
🟢 Green Line (90th Percentile): Fantastic outcomes
🔵 Blue Line (Median): Probable trajectory
🔴 Red Line (10th Percentile): Worst-case but plausible
In retirement planning, the 10th percentile is your stress test. If that line dips close to zero or flattens early, it’s a sign that you may need to lower spending, increase contributions, or adjust your asset allocation.
A 100% success rate might feel comforting. But if your 10th percentile result shows an ending balance of just $29,270, that might not be enough cushion for late-life expenses like healthcare, family support, or rising inflation.
Questions to ask yourself:
Am I okay with the downside scenario?
Would I sleep well if I ended up with the minimum projected balance?
What would I do differently if I knew that’s where I’d land?
What happens if markets soar?
What if they crash early?
How long can I safely withdraw from this portfolio?
How sensitive am I to inflation or volatility?
Use these insights to refine your retirement plan. Real life will never match any single simulation, but thoughtful planning prepares you for the range of outcomes.
Don’t Know Where to Start? Try a Reference Portfolio
Not sure how to set your parameters? The simulator includes a collection of reference portfolios designed to reflect common investor profiles across different life stages and risk preferences.
These templates serve as a launchpad; run them as-is or tweak them to better reflect your personal goals.
🟢 Young Investor
Long time horizon with low starting capital
Initial: $10,000
Annual Contribution: $6,000
Time Horizon: 40 years
Retirement Year: Year 35
Why it matters: This profile shows the power of time and compound interest. Small early contributions can grow substantially with consistent investing even if markets are volatile.
🔵 Middle-Aged Investor
Shorter time horizon with higher capital
Initial: $250,000
Annual Contribution: $25,000
Time Horizon: 25 years
Retirement Year: Year 15
Why it matters: This reflects someone in their 40s or early 50s, ramping up savings while still capturing growth. It’s a great middle ground between accumulation and retirement preparation.
🟠 Retiree
Short time horizon with high capital, no contributions
Initial: $1,000,000
Annual Contribution: $0
Time Horizon: 30 years
Retirement Year: Year 1
Why it matters: This scenario is focused entirely on preservation and drawdown. Ideal for testing how different withdrawal rates and market sequences impact your financial longevity.
🟣 Variable Withdrawal Retiree
Retiree with dynamic withdrawal rates
Initial: $1,000,000
Annual Contribution: $0
Time Horizon: 30 years
Retirement Year: Year 1
Why it matters: This lets you explore the impact of adjusting spending patterns—for instance, spending less in bear markets or more during good years. A flexible withdrawal plan can dramatically improve outcomes and reduce sequence risk.
🟣 Crypto Enthusiast
Higher risk allocation with significant crypto exposure
Initial: $100,000
Annual Contribution: $10,000
Time Horizon: 30 years
Retirement Year: Year 20
Why it matters: High volatility, high reward — this profile helps you visualize the upside (and potential downside) of allocating a portion of your portfolio to crypto assets.
Why These Reference Portfolios Matter
These presets reflect real-life archetypes. You might not fit any one profile exactly, but running them offers perspective:
What happens if you save more aggressively?
How does early retirement affect drawdown risk?
What does a 100% equity or crypto-heavy portfolio look like in retirement?
They also make it easy to test what-if scenarios without having to guess at every number.
⚠️ The Hidden Danger: Sequence of Returns Risk
One of the most underappreciated risks in retirement isn’t average return—it’s the order of those returns.
Sequence of returns risk means that even if your average return is strong, suffering bad years early in retirement can deplete your portfolio faster than expected—especially if you’re withdrawing from it.
For example, two retirees with identical portfolios and average returns can have dramatically different outcomes based solely on when the market crashes occur. It’s not just how much you earn over time, but when you earn it.
To help illustrate this, my simulator includes the Variable Withdrawal Retiree reference portfolio to give you an idea of how sequence of returns risk can impact the longevity of the portfolio.
Plan with Probabilities, Not Certainties
No simulator can predict the future. But Monte Carlo simulations offer a sober look at your odds and an informed way to assess risk and adjust your plans.
If you fail to plan, you are planning to fail.
Use the data to guide your lifestyle assumptions, savings goals, and asset allocation. If your plan shows a 90% success rate, great. If it's only 50%, it’s better to know now, while you still have time to adjust.
Here’s the link to the simulator again to get started: Fortune Forecast Funnel
If you’d like to understand some of the terms used in this article and wonder why some values are presented the way they are, head on over to the glossary and FAQ for deeper understanding.
All information presented here is not financial advice. Do your own research, and if in doubt, please seek professional advice.